
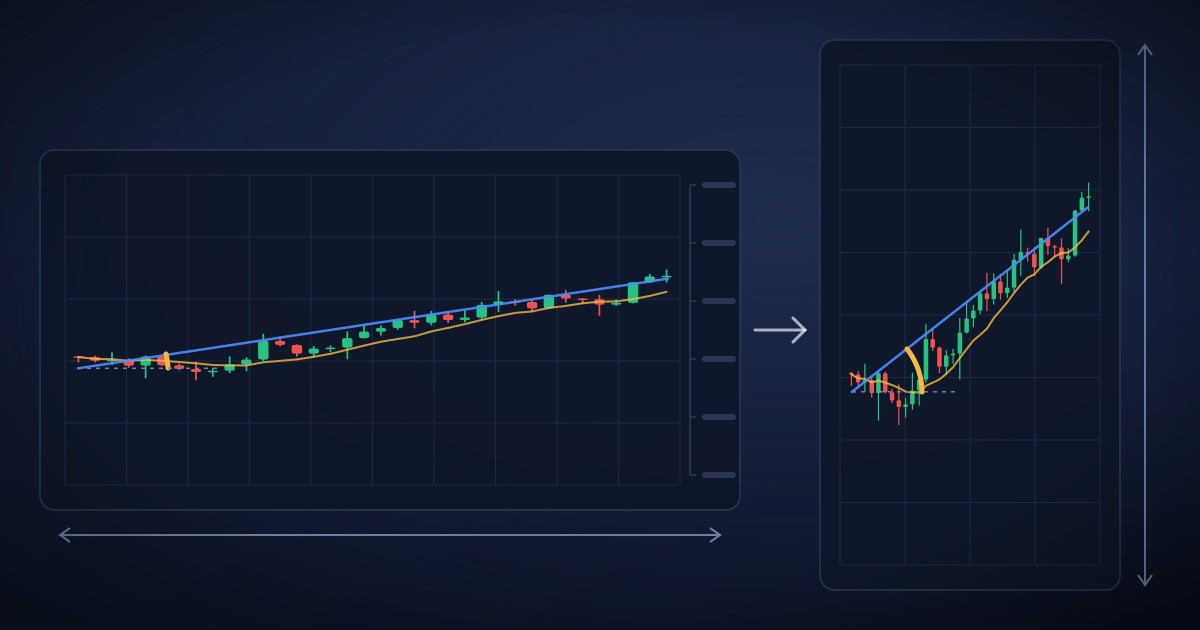
Stretch a chart vertically and a modest move can look dramatic. Widen the window and the same move appears calmer. Nothing in the price series has changed, yet the apparent angle has.
That is why the geometry used in CCGO starts by defining coordinates and units. A numerical slope must specify whether it measures raw price movement or movement scaled by volatility, and what counts as a unit of time. Without those definitions, comparisons can mix market behaviour with display settings.
Try resizing a chart before trusting a visual conclusion. If the conclusion changes while the observations stay fixed, presentation is doing part of the persuading. A reproducible measurement should survive a differently shaped window.
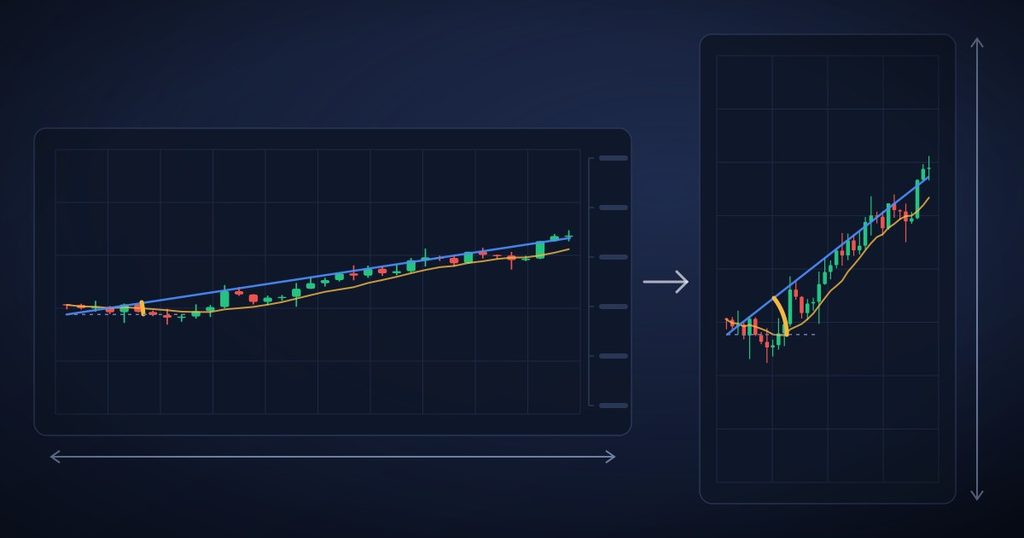
حين يتغير شكل السوق بتغيير حجم النافذة
يمكنك جعل موجة السعر تبدو شديدة الانحدار أو هادئة بمجرد تمديد نافذة الشارت. السعر لم يتغير، لكن العين ترى زاوية مختلفة. لذلك لا تكفي زاوية مرسومة على الشاشة للحكم على قوة الحركة أو مقارنتها بأداة أخرى.
يعالج البناء الهندسي في CCGO هذه المشكلة بتعريف الإحداثيات ووحدات القياس أولا. وعندما نحسب ميلا عدديا، ينبغي أن نعرف هل نقيس تغير السعر الخام أم حركة مقيسة بالتقلب، وعلى أي محور زمني. اختبار مفيد لأي ملاحظة بصرية هو تغيير أبعاد الرسم. إذا تغير الاستنتاج بينما بقيت البيانات نفسها، فجزء من القناعة جاء من طريقة العرض. عندها نحتاج إلى قياس ثابت يمكن مراجعته، لا إلى تكبير الصورة.

